EX-99.2
Published on June 19, 2002
Exhibit 99.2
Planned Evolution
Customer Evolution
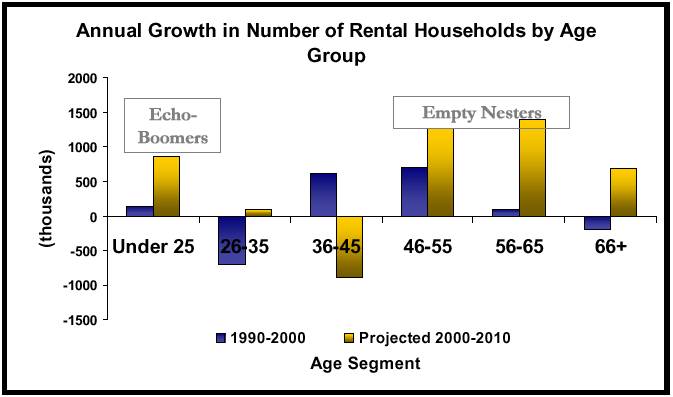
Knowing and Serving Our Customer
Projected growth from empty nester baby boomers and
echo-boomers
![]()
1
Planned Evolution
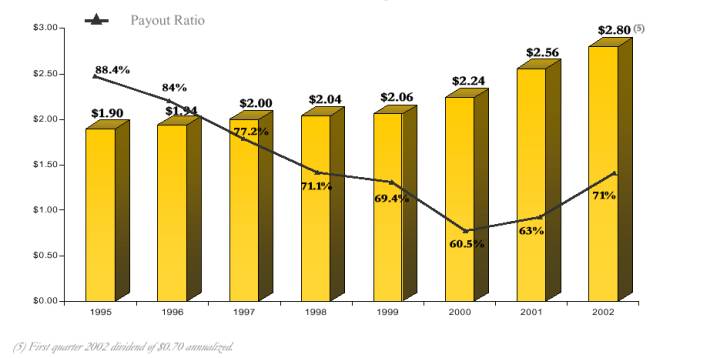
Outsized Performance
Dividends - Safety and Growth
![]()
2
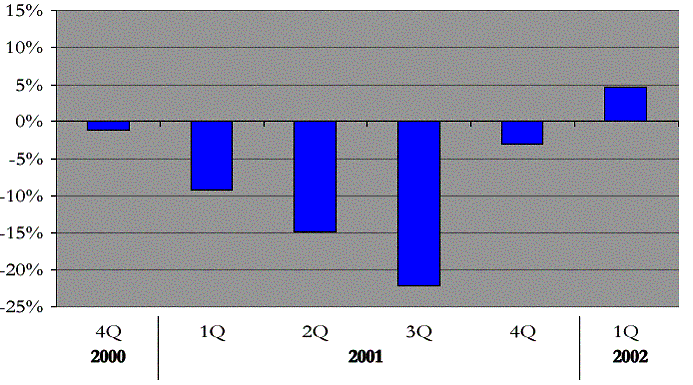
Market Research: Application
Short-Term
Corporate Profits % Change vs. Year Ago

3
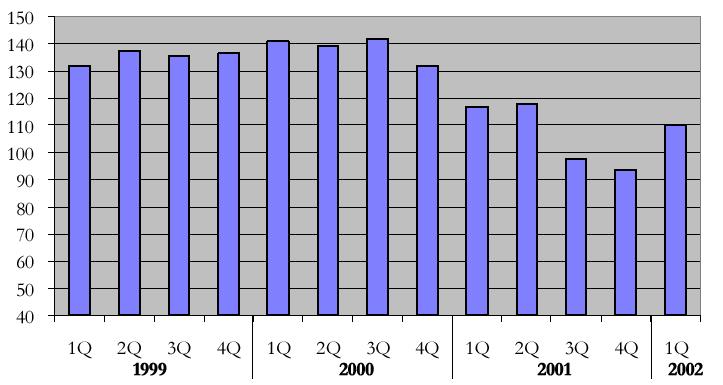
Market Research: Application
Short-Term
Consumer Confidence

4
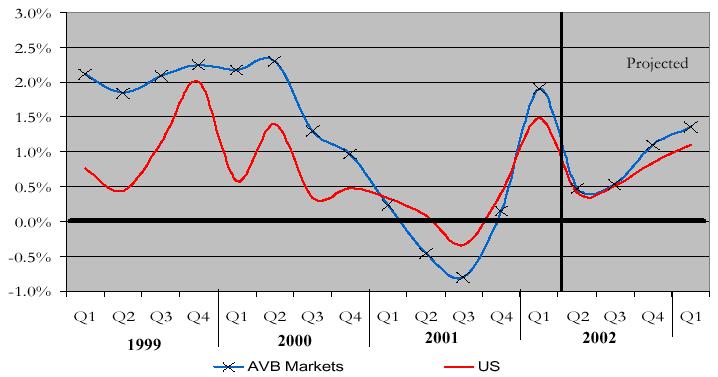
Market Research: Application
Short-Term
GDP Growth
![]()
5
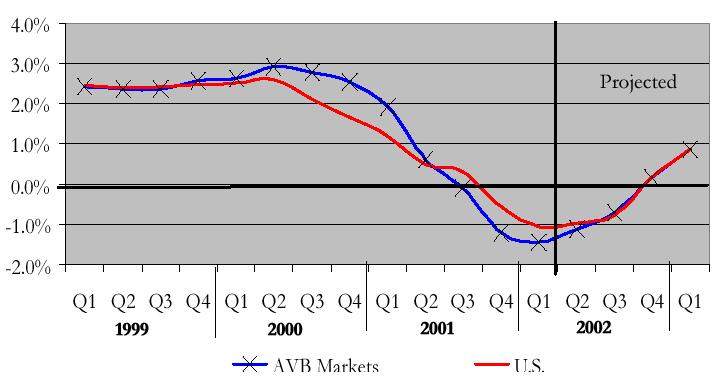
Market Research: Application
Short-Term
Annual Employment Growth

6
Market Research: Application
Short-Term
Single-Family Home Sales
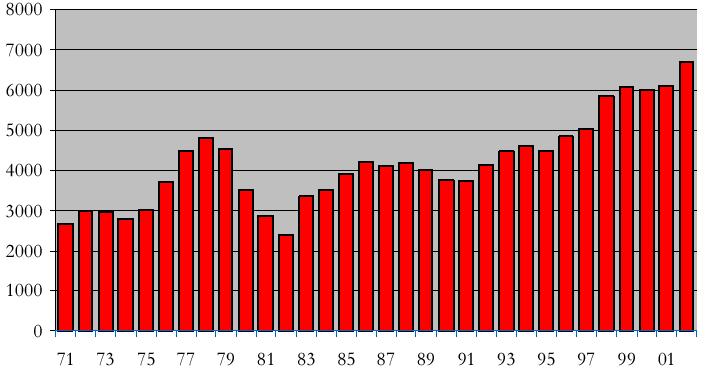

7
Market Research: Application
Short-Term
New Supply as a % Total Inventory
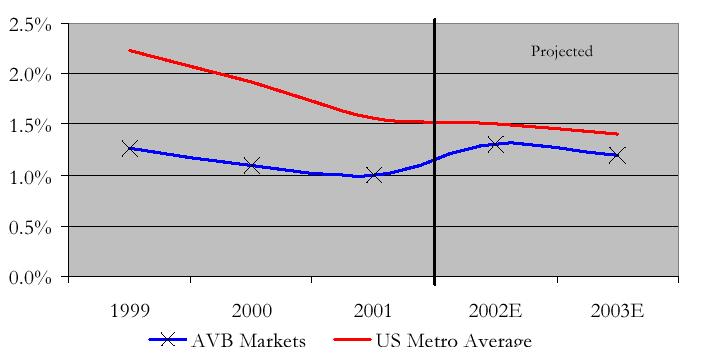

8
Market Research: Application
Short-Term
Demand/Supply Ratio
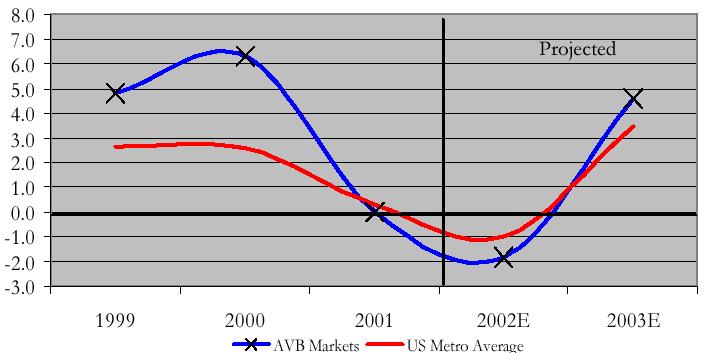

9
Market Research: Application
Short-Term
Occupancy (REIS)
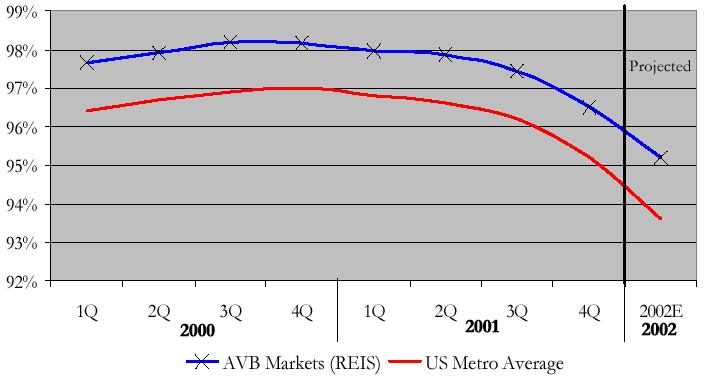

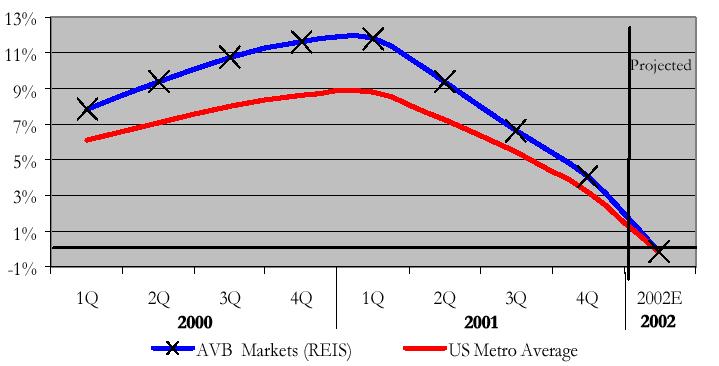
10
Market Research: Application
Short-Term
Annualized Rental Rate Growth (REIS)

11
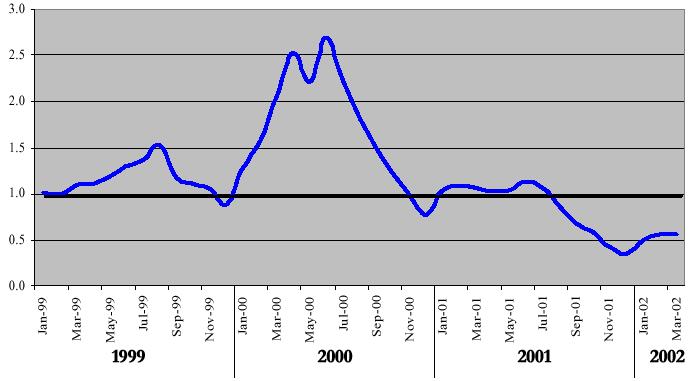
Market Research: Application
Short-Term
Traffic/Available Homes
![]()
12
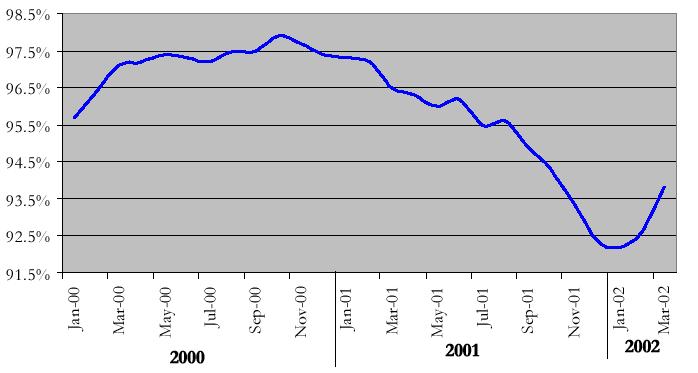
Market Research: Application
Short-Term
Economic Occupancy
![]()
13
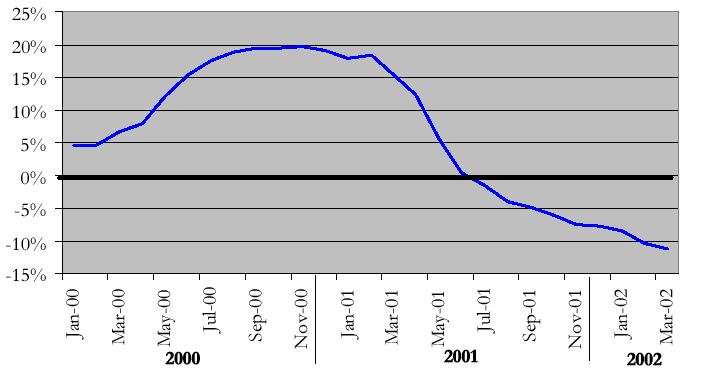
Market Research: Application
Short-Term
Market Rent Growth
![]()
14
Market Research: Application
Longer-Term
Average Annual Employment Growth (1998 2003)
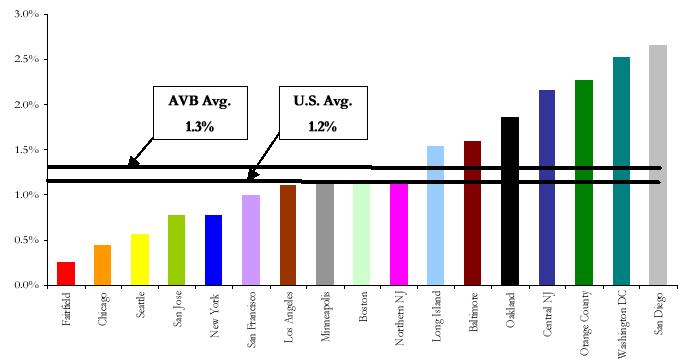
Source: Economy.com (non-farm, non-construction employment)
![]()
15
Market Research: Application
Longer-Term
Completions as % of Inventory (1998-2003)
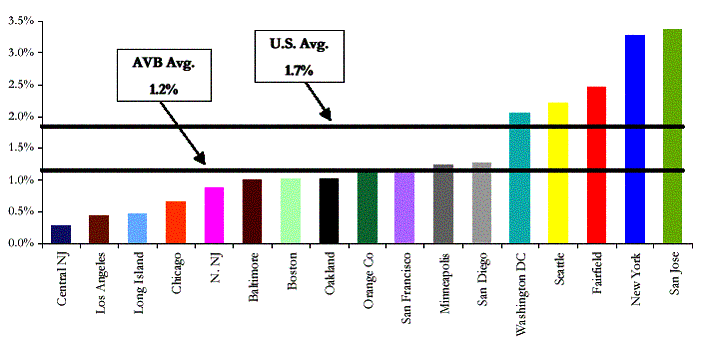
Defined as New Supply as % Total Apartment Inventory
Source: Reis Reports/AVB
![]()
16
Market Research: Application
Longer-Term
Demand/Supply (1998 2003)
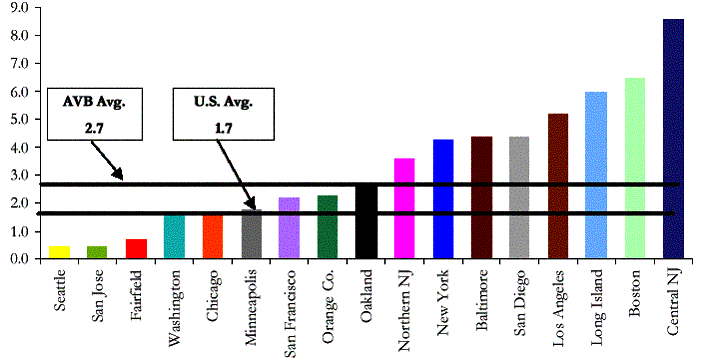
Source: REIS, Economy.com, AVB
D/S= (Household Growth/Employ. Growth) x Employ. ) / New Supply
![]()
17
Market Research: Application
Longer-Term
Housing Affordability (4Q01)
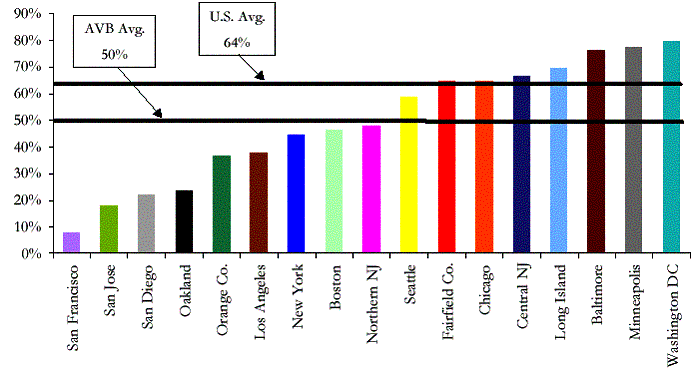
Source: NAHB. Based on % of households that can afford median sales price.
![]()
18
Market Research: Application
Longer-Term
Market Rent Growth (1998 2003)
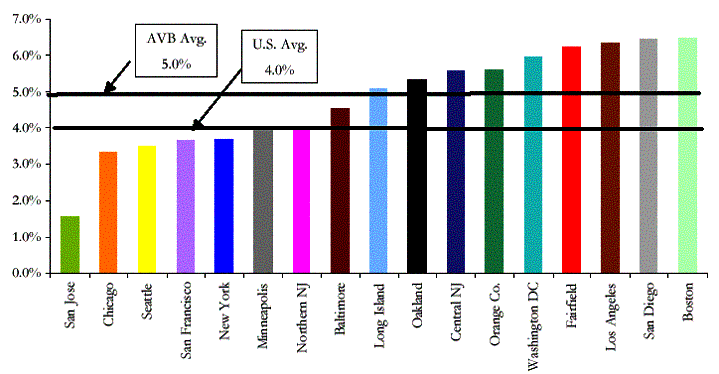
Source: REIS Reports
![]()
19
AVB Resident Profile
73% of Residents in $50,000+ Income Bracket
|
Household Income |
|
Percent |
|
|
< $25,000 |
|
7% |
|
|
$25,000 - $49,999 |
|
20% |
|
|
$50,000 - $74,999 |
|
24% |
|
|
$75,000 - $99,999 |
|
20% |
|
|
$100,000 or more |
|
29% |
|
![]()
20
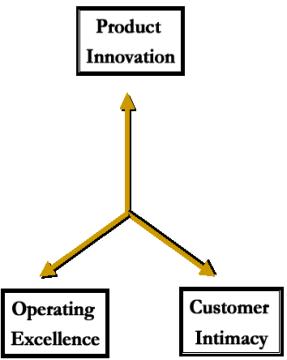
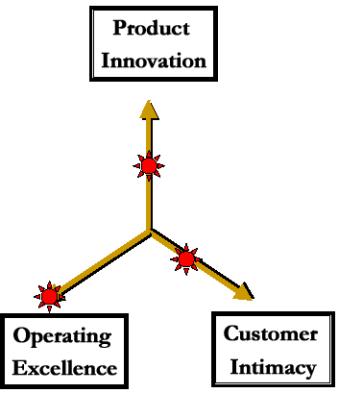
What is the right approach at AVB?
|
|
Ø |
Operating Excellence is our Competitive Advantage |
|
|
|
|
|
|
|
Ø |
Operating Excellence will Maximize Shareholder Value |
|
|
|
|
|
|
|
|
Ø |
Customer Knowledge and Service fall within Operating Excellence |
|
![]()
21
What is the right approach at AVB?
|
|
|
|
|
|
|
Where we want to
be |
|
|
|
|
|
|
![]()
22
The Customer Focus Journey
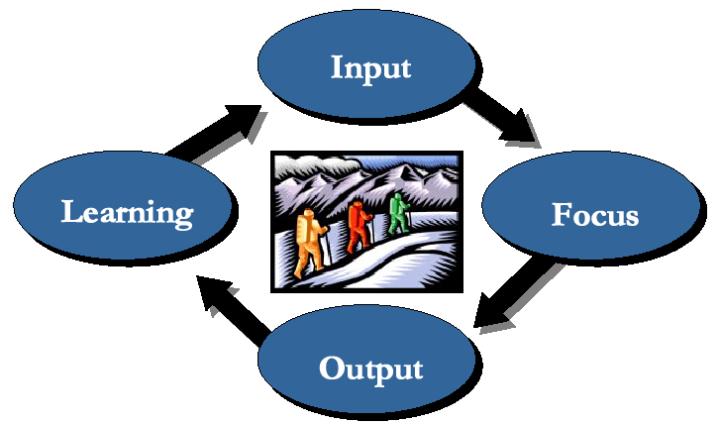
![]()
23
How will this affect our Residents?

|
Customer Focus |
|
Emotional Bond with Brand |
|
Customer |
|
![]()
24
How will Customer Focus benefit AVB?
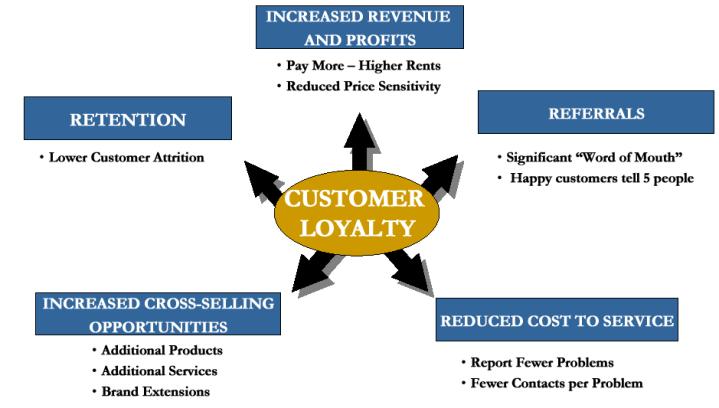
![]()
25
Decentralized Execution
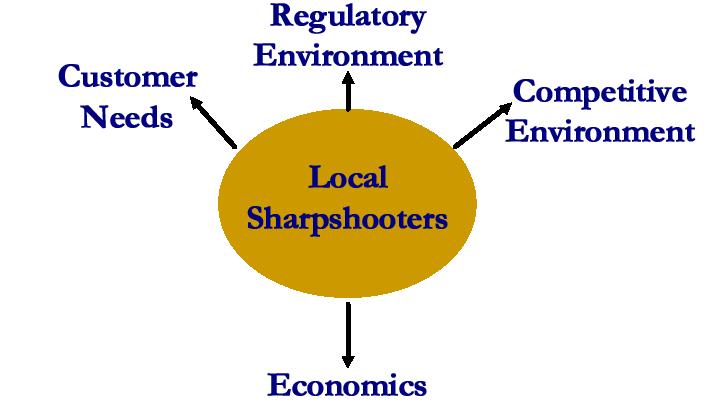
![]()
26
Experienced Management Team
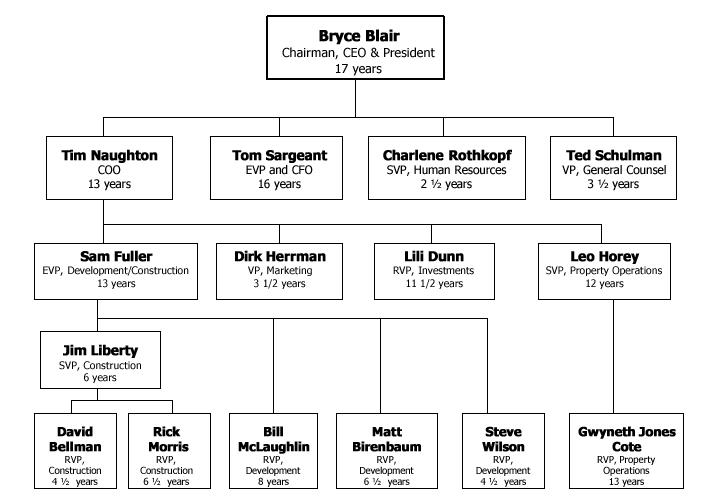
![]()
27
Business Update
Market & Operating Trends
Employment Growth (by sequential quarter)
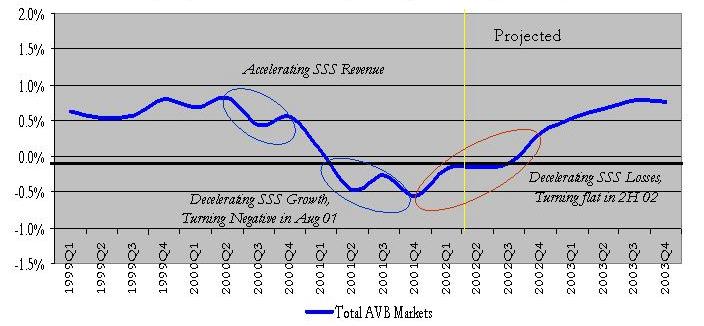
1999 | 2000 | 2001 | 2002 | 2003
![]()
28
Business Update
Average Economic Occupancy
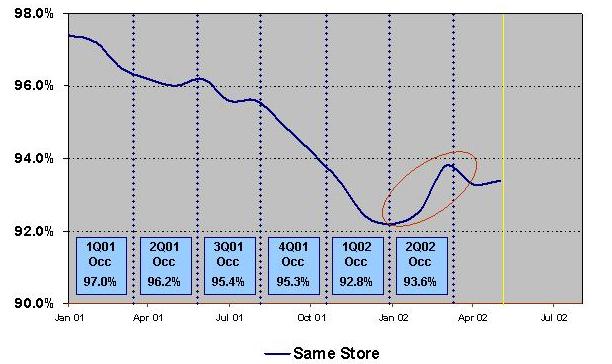
![]()
29
Business Update
Annual Market Rent Growth
May 2002
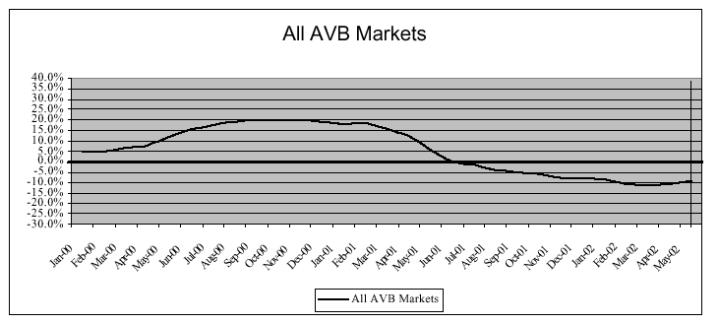
![]()
30
Business Update
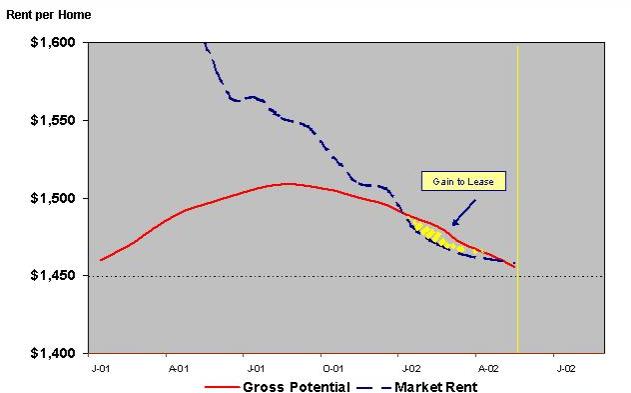
Market Rent & Gross Potential Per Apt
![]()
31
Business Update
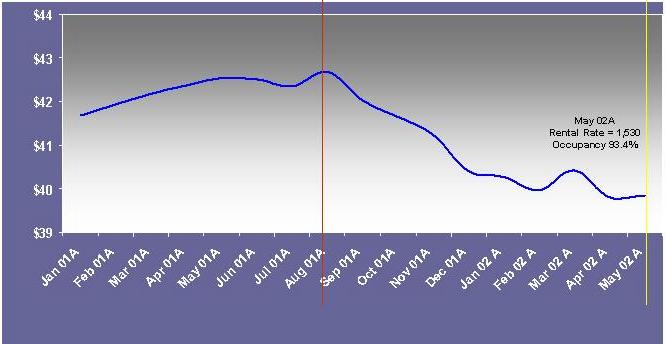
Same Store Revenue
Historical
$ Millions per month
![]()
32
